While working on the Kohonen Self Organizing Map, I encountered difficulties in understanding how the axis parameter in NumPy works. Initially, in a 2-dimensional scenario, we have coordinates (x, y), where x represents the width or number of rows, and y represents the height or number of columns in the matrix. However, things become more complex when we introduce another dimension.
For instance, let’s consider an array of pixels with a size of 10x10 and three color channels: Red, Green, and Blue. This array would be represented as (10, 10, 3), indicating the dimensions of width, height, and depth respectively. Here’s my understanding of it:
Imagine you have three sheets of paper stacked on top of each other. The first sheet corresponds to (:,:,0), the second sheet to (:,:,1), and the third sheet to (:,:,2). Each sheet represents one of the color channels. If we wanted to sum up the values across all three channels, we can use the np.sum(matrix, axis=2) function. In this case, we can visualize it as the z-axis.
import numpy as np
import matplotlib.pyplot as plt
from mpl_toolkits.mplot3d import Axes3D
# Define the matrix
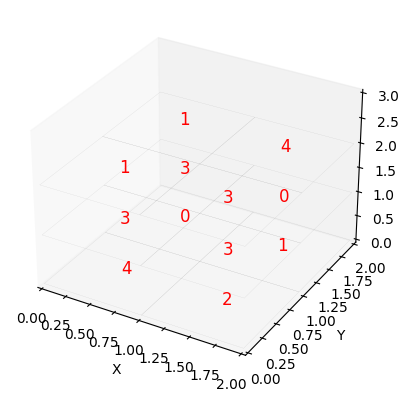
w = np.random.randint(5, size=(2, 2, 3))
# Get the shape of the matrix
width, height, depth = w.shape
# Create a figure and a 3D axis
fig = plt.figure()
ax = fig.add_subplot(111, projection='3d')
# Iterate over each block in the matrix
for z in range(depth):
for y in range(height):
for x in range(width):
# Get the number in the current block
number = w[x, y, z]
# Plot a cube with the number as the label
ax.text(x + 0.7, y + 0.25, z + 0.5, str(number), color='red',
ha='center', va='center', fontsize=12)
# Plot the edges of the cube with a line width of 2
ax.plot([x, x+1, x+1, x, x], [y, y, y+1, y+1, y],
[z, z, z, z, z], 'grey', linewidth=0.05)
# Set the labels for the axes
ax.set_xlabel('X')
ax.set_ylabel('Y')
ax.set_zlabel('Z')
# Set the plot limits
ax.set_xlim(0, width)
ax.set_ylim(0, height)
ax.set_zlim(0, depth)
# Hide the grid
ax.grid(False)
# Show the plot
plt.show()
# x=0; y=0, z=0
print("\nx=0\n",w[0,:,:],"\ny=0\n",w[:,0,:],"\nz=0\n",w[:,:,0])
x=0
 [[4 3 1]
 [0 3 1]]
y=0
 [[4 3 1]
 [2 3 3]]
z=0
 [[4 0]
 [2 1]]
np.sum(w, axis=2)
array([[8, 4],
       [8, 5]])